Create initial dashboard
This section explains how to setup a dashboard to view orders.
The main purpose is to make a user familiar with SnowSight.
Once a user is logged in, the default Snowsight environment is shown:
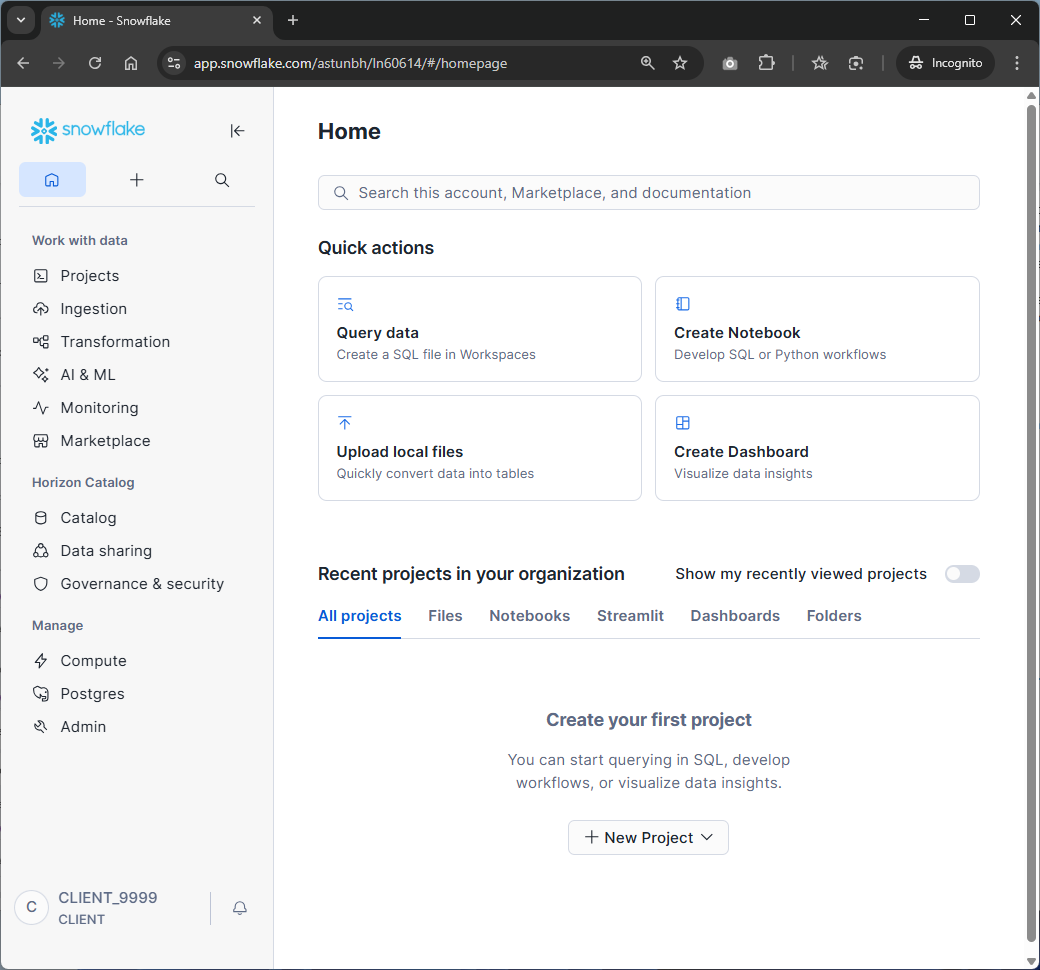
Click on Projects - Dashboards.
Then click on the “+” in the top-right to create a new Dashboard.
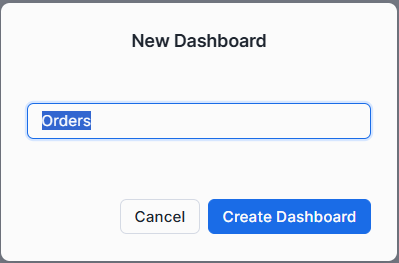
Give it a name like “Orders” and click “Create Dashboard”:
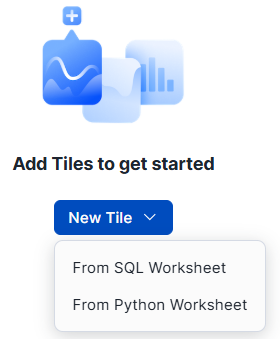
Click on "New Tile", "From SQL Worksheet":
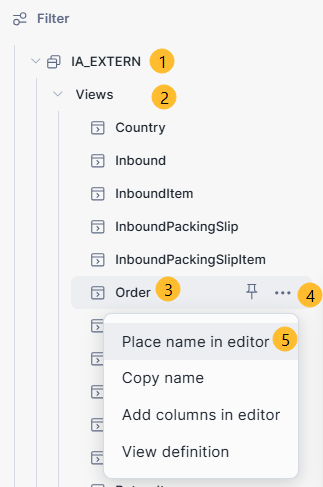
In the left bar you can select a database. For now: always use “DWH_DEV” as the database. Then select a schema. Clients only have access to the “IA_EXTERN” schema.
Under IA_Extern, select “views”, then the view “Order”. Click on the epsilon to get the menu, and then select "Place name in editor":
Now change the query to look like this:
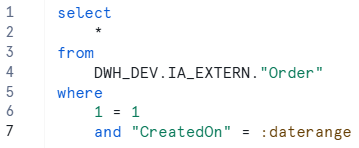
You can now execute it by hitting CTRL-Enter or by clicking on the run-symbol:  .
.
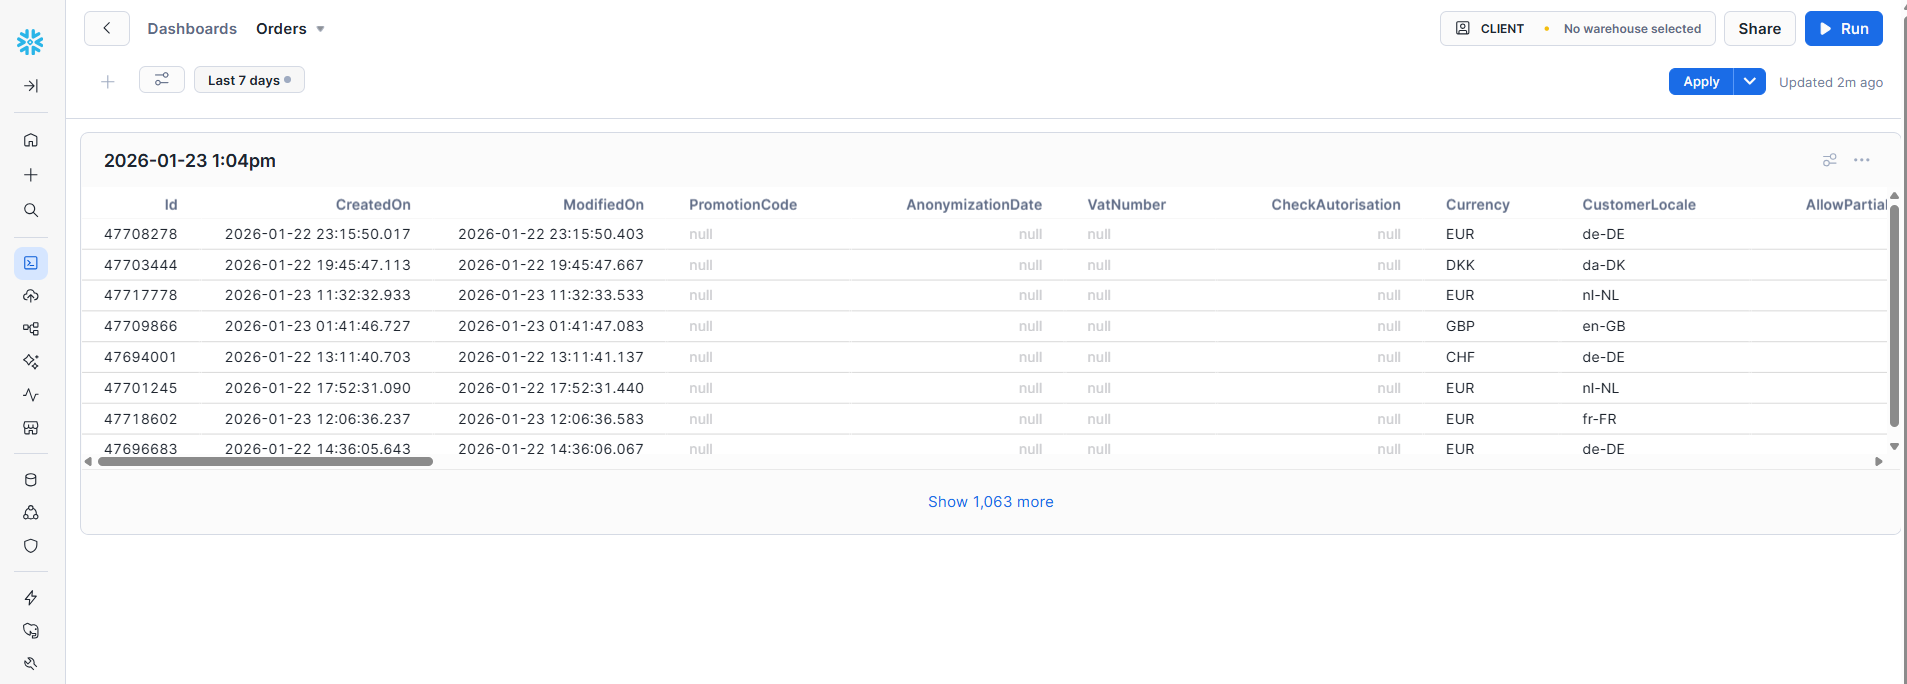
When you click on “Return to Orders” in the top left, your Dashboard is saved and you’ll see the results.
Note that because you added the where-clause "and "CreatedOn" = :daterange", you automatically implemented a dashboard filter. Initially that is set to "Last day". You can change this to "Last 7 days" or anything you want. Just remember to hit the "Apply" button at the top-right.
The initial results of the query are shown in your dashboard:
You can then click on the "Show xxx more"-link at the bottom to see all results:
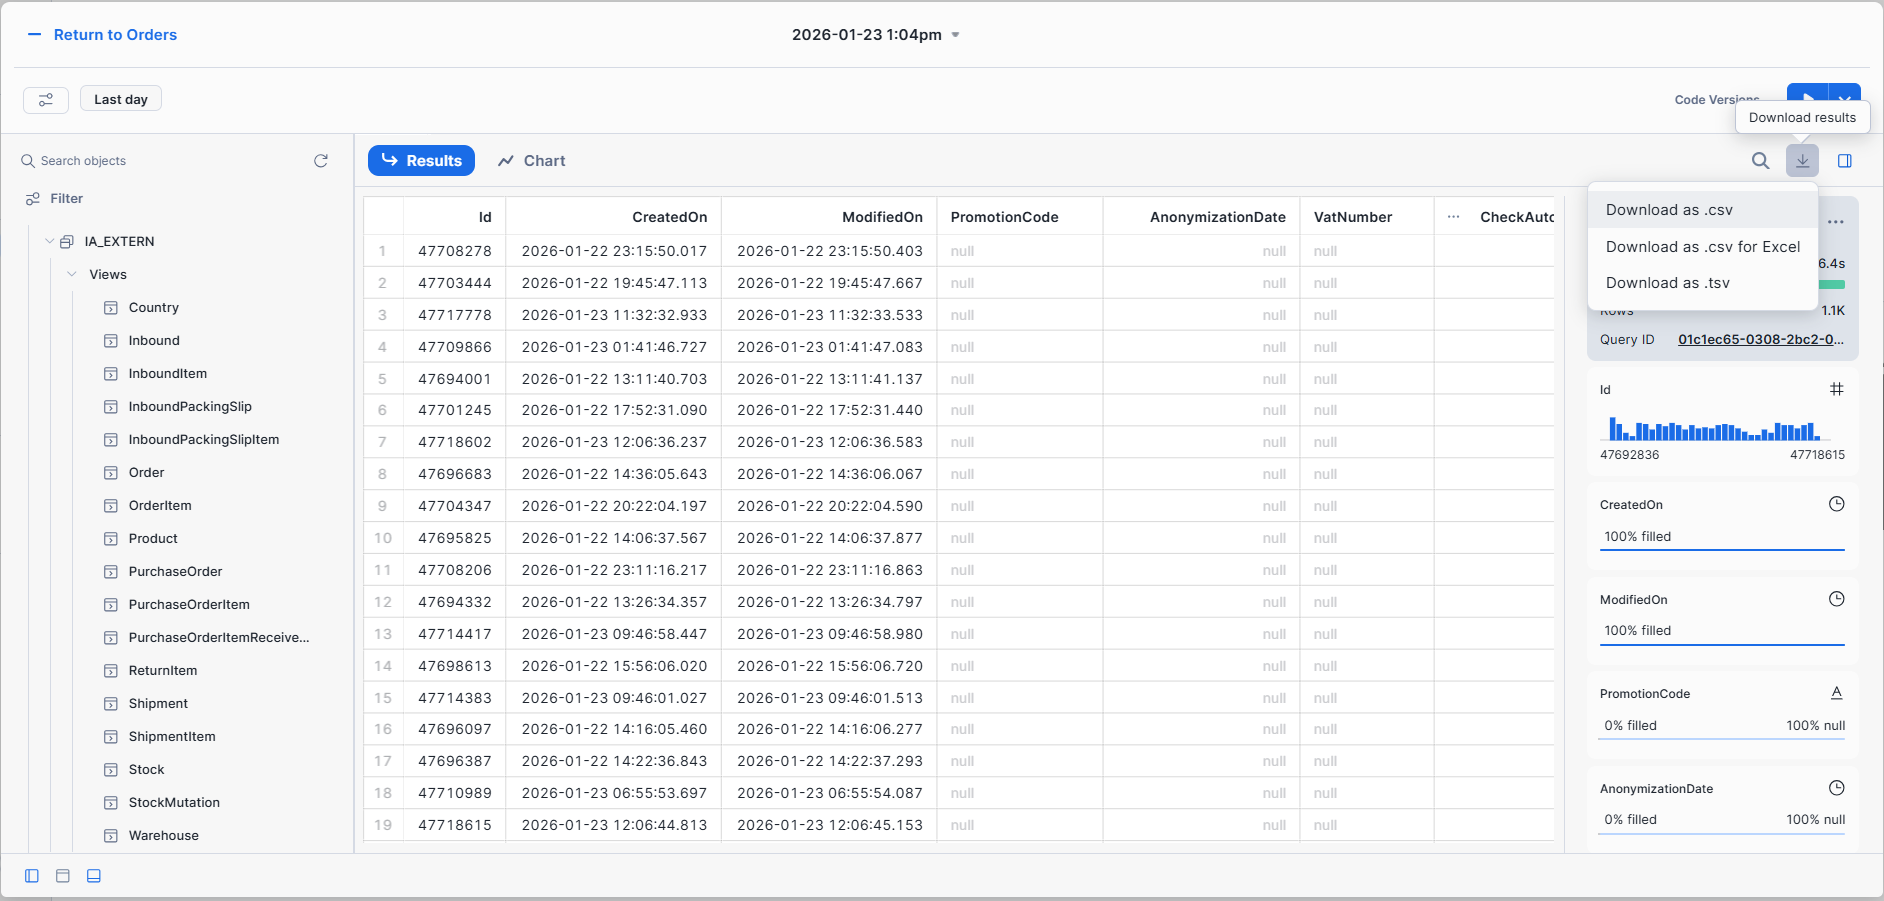
From here you can select the "download" button, and select which type of format you want for the download (CSV, CSV for Excel, TSV). In most cases the TSV (Tab Seperated Values) works best.
You have now created your first dashboard. This is convenient for quick access.
For a more elaborate way of accessing your data, you’ll need to use a connection like ODBC (next section). By using an ODBC connection you no loner need to download CSV/TSV files, but can refresh your data directly in Excel.